Event Forecast Report
Learning Objectives
Report Overview
The Event Forecast Report is a standard report that is used by the catering team. It allows catering managers to analyse total revenue by event type and status for a specified date range.
Report Uses
This report is used by catering managers to forecast event revenue.
How to Run the Report
To run the report, follow these steps:
Click on the ‘Reports’ tab, ‘All Folders’ on the left side, and click on ‘Thynk Reports’.
Find the ‘Event Forecast Report’ and click on it.
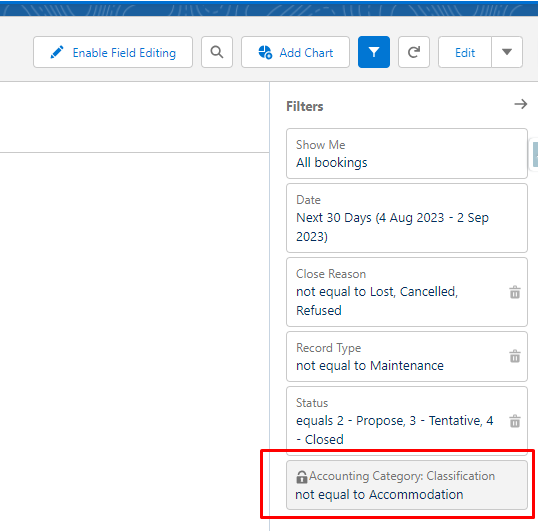
As in other reports, this will run using predefined filters:
All bookings
Date - default to next 30 days
Close Reason not equal to Lost, Cancelled and Refused (i.e. Definite status only or Closed Reason: Won)
Record Type - not equal to maintenance (excludes those that are OOO)
Accounting Category - not equal to Accommodation
Status - default to all but Closed-Lost, Canceled, Refused
As always with any report, you can edit these filters if needed by editing the report.
And, you can click into any of the bookings you see listed in the report.
Information Displayed on the Report
The following information appears on your report:
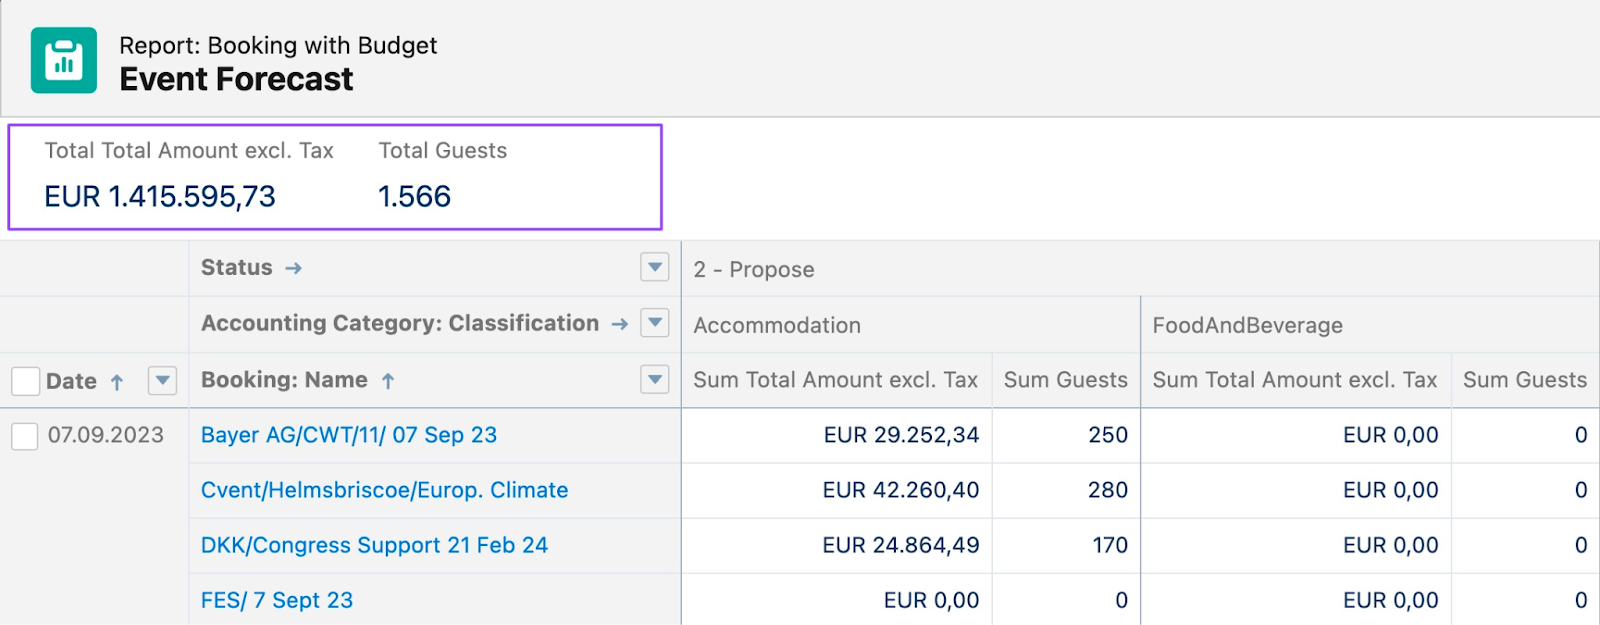
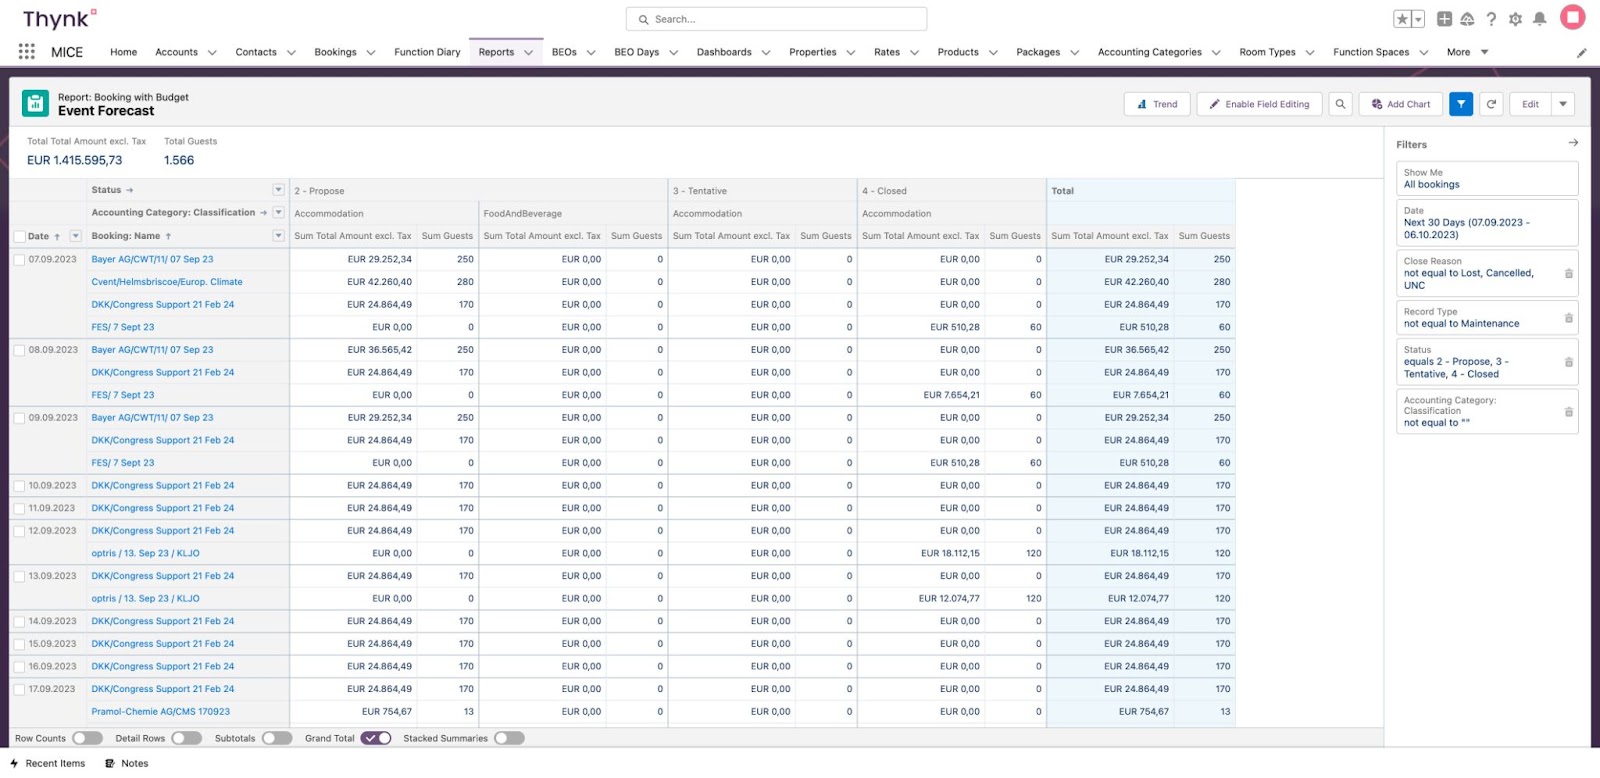
Immediately under the report name, you will see the ‘total revenue excluding taxes’ in the selected currency, and the ‘Total Guests’.
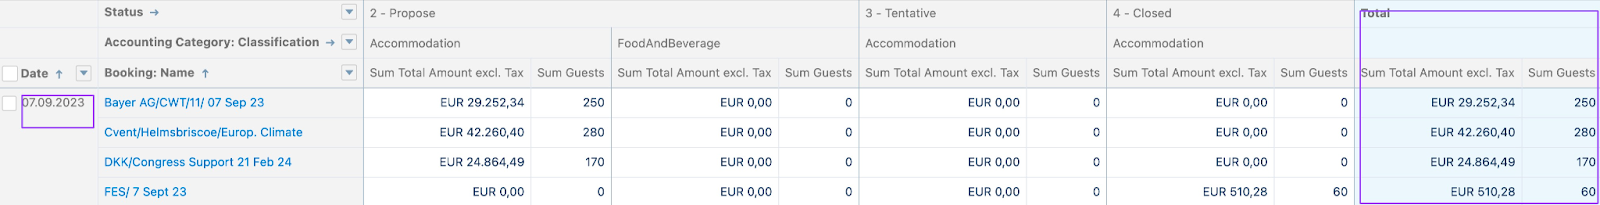
Under this, the information is organised by booking status, and accounting category. You can see by event date, the booking name, the total revenue excluding taxes, total guests by ‘Accounting Category’ - in this example: ‘Accommodation’.
Moving to the right, you see the next Accounting Category Food & Beverage totals.
Scroll all the way to the right for totals per day.
Keep scrolling down to see all your events in the next 30 days.
On the bottom, there are totals, once again.
The totals under each column are totals by Accounting Category.
Resources
Related Articles
Event Listing Report
Learning Objectives In this lesson, you will learn... 1. How to use an Event Listing Report. 2. How to edit an Event Listing Report. 3. How to run an Event Listing Report. Report Overview The Event Listing Report displays a list of events for a ...Kitchen Report
Kitchen Report Learning Objectives In this lesson, you will learn how to... 1. How to use a kitchen report. 2. How to run a kitchen report. 3. How to view information displayed in a kitchen report. Report Overview The Kitchen report lists all menus ...Lost Business Report
Learning Objectives In this lesson, you will learn... 1. How to file a report for a booking that has been lost, cancelled, or turned down. 2. How to run Lost Business Reports. 3. How to view information displayed on the report. Report Overview The ...Account Listing Report
Learning Objectives At the end of this lesson you will know how to…. Run the Account Listing Report Edit the report as needed Account Listing Report The Account Listing Report shows a list of accounts to see the current worth of each account so ...Contact Listing Report
Learning Objectives In this lesson, you will learn how to... 1. Run reports for contact listing. 2. Add new reports. 3. View information displayed on the report. Report Overview Displays a list of contacts from a particular area or source depending ...