Account Production Dashboard
Learning Objectives
At the end of this article you will know….
Where to go to see total production figures and compare them to last year
Where to find the Account Production Dashboard
Make slight edits to the filters
Where to read the information displayed on the dashboard
Dashboard Uses
Viewing account production figures in rooms, revenue and ADR, is one of the most important requirements for sales managers and directors.
- Total account production in rooms, revenue and ADR
- Agency production
- Compare to last year
- Top accounts
- Top agencies
- Top contacts
How to View the Account Production Dashboard
- At the Home Page, click on the ‘Thynk Dashboards' tab. If you don’t see this tab, click on the ‘Applications’ (the 9 dots on the top left) and search for Thynk Dashboards. Click on it to create and save a ‘Thynk Dashboards’ tab for ease.
- Once in the Thynk Dashboard, click on the Account Production to run it.
- The filters are already set up. By default you will see Consumption Date YTD plus one year in the future, all properties, and all accounts, all agencies, and all revenue categories. You can change any of these filters. If you wish to see production of just one specific account, you can click on the down arrow on the ‘Account Name’ button and search for your account there.
The default shows you a breakdown by month, which you can also change to show you Year To Date numbers.
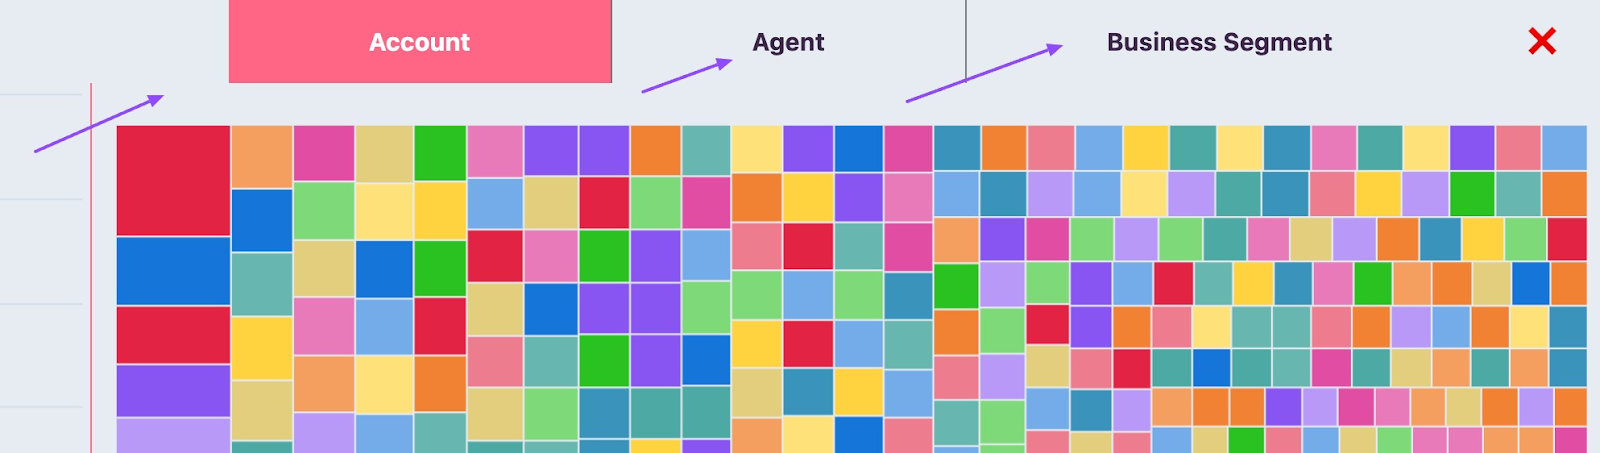
Click on ‘Show breakdown’ and you will see more information on the right side of the dashboard.
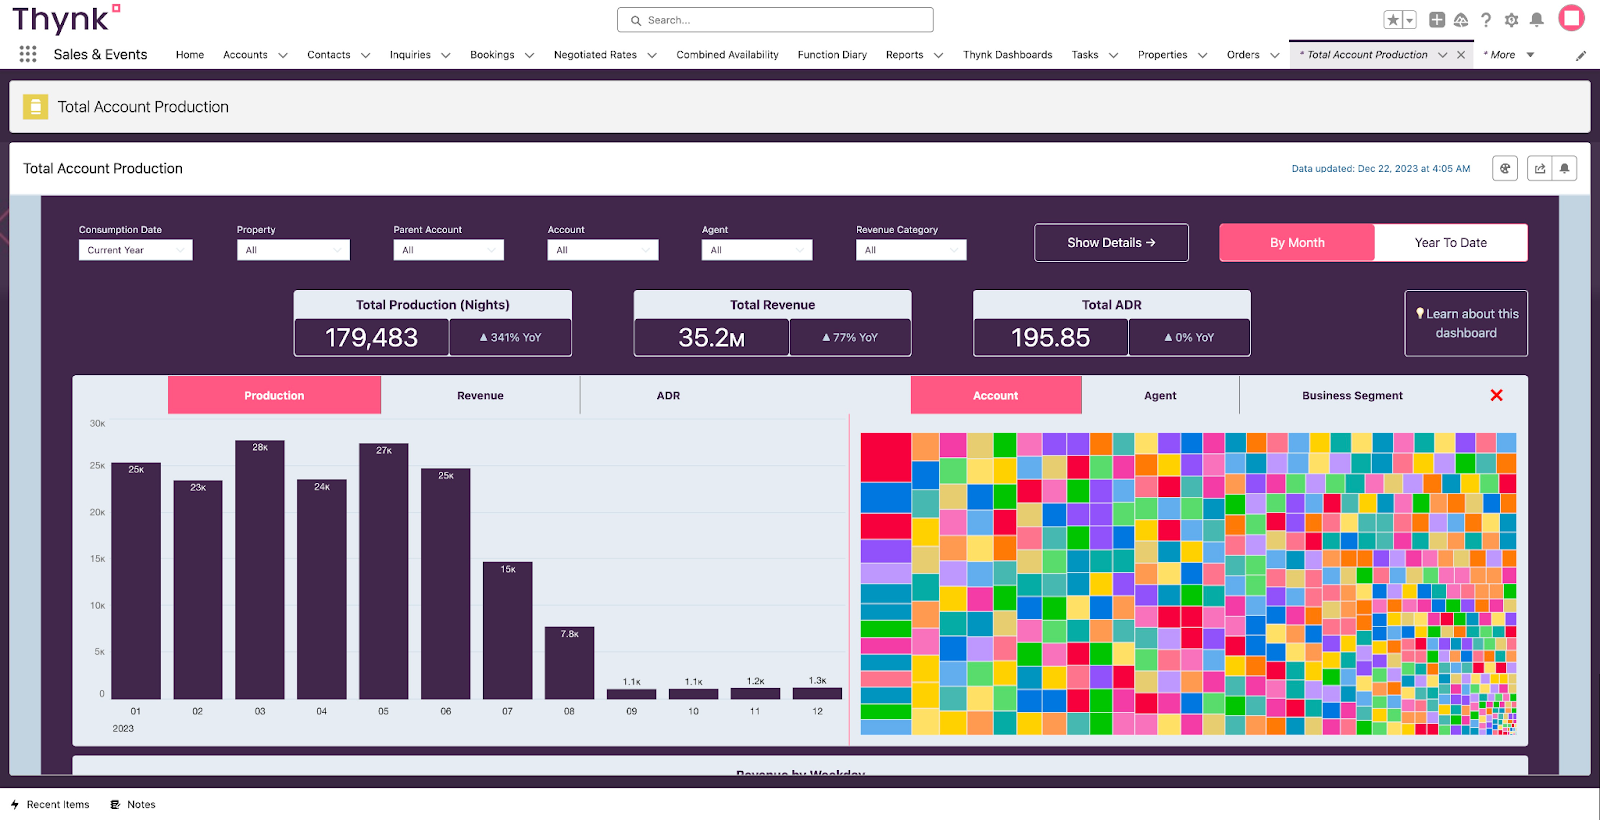
You can select your production information by account, agencies, or business segment. So if you want to know which market segment/business segment is the higher producer, you can click on ‘business segment’.
You can also choose to view production by room nights, revenue or ADR.
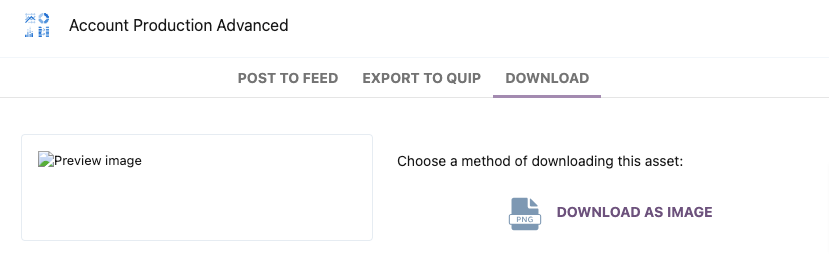
You can download an image of this dashboard, by clicking on the ‘Share’ icon on top right, and click on the ‘Download’ tab, and ‘Download as Image’.
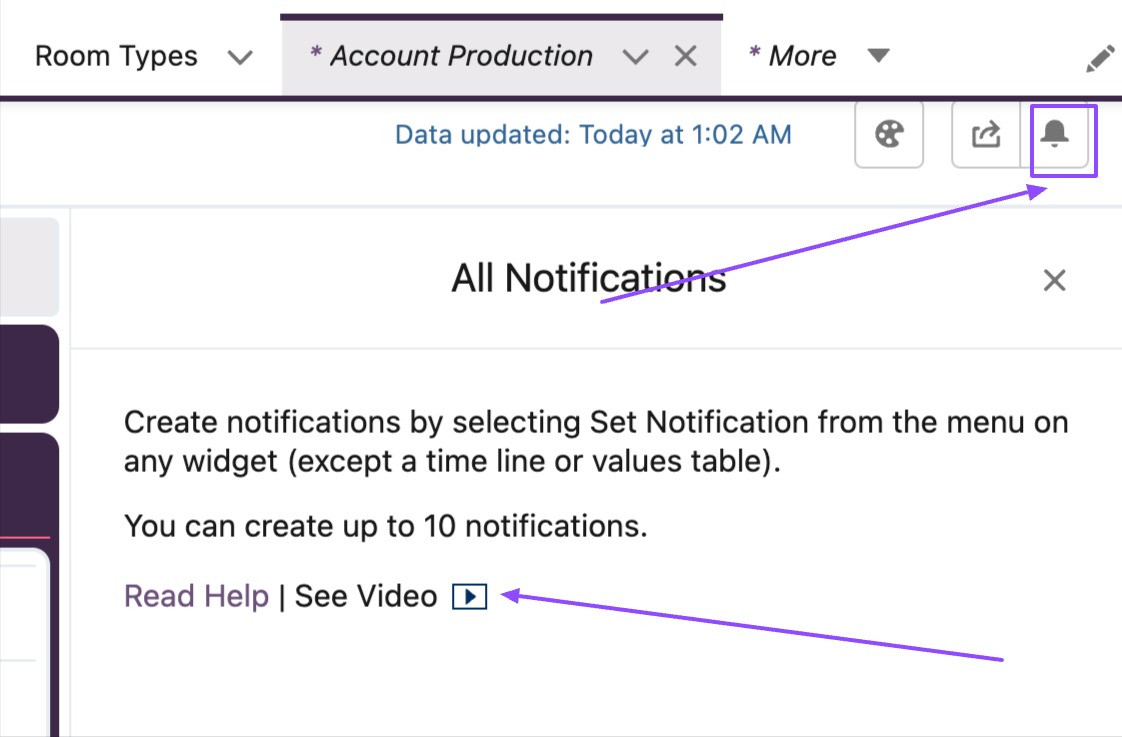
To view notifications click on the notification (bell) icon.
To set up notifications (maybe you want to know when a certain account reaches a certain level of revenue booked), there is a great ‘how to’ video if you click on the notification/bell icon.
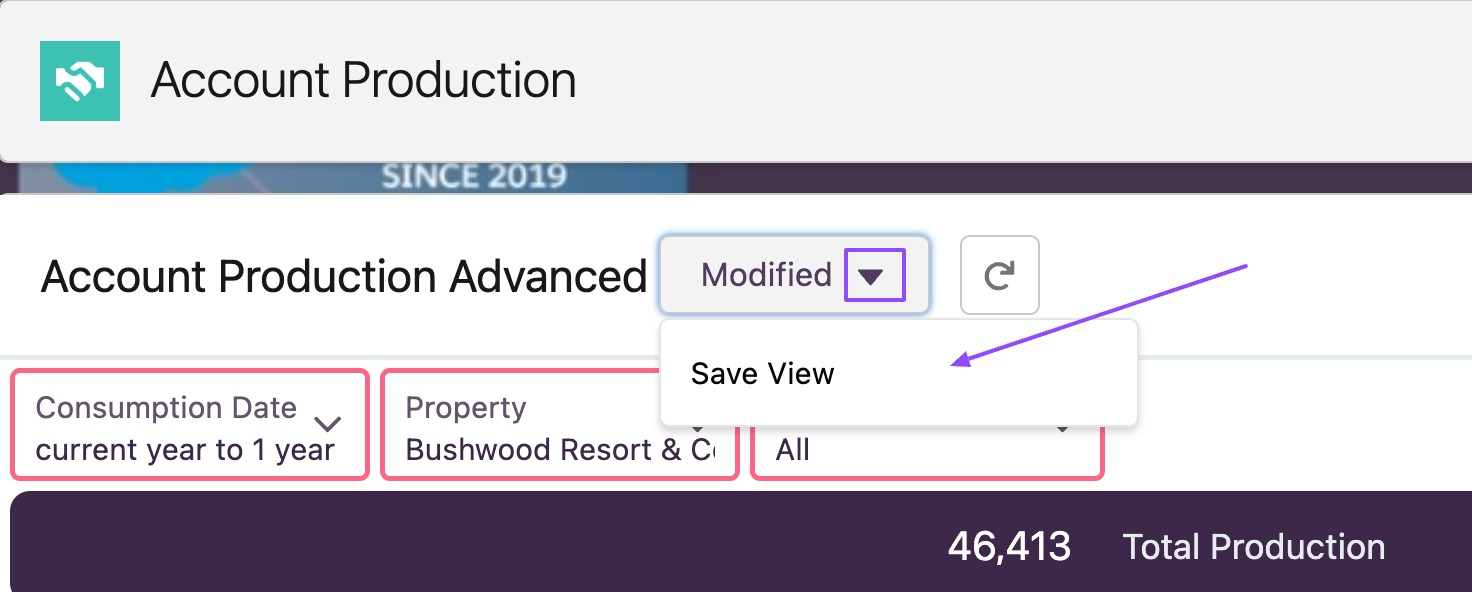
Important: If you are looking around in the report and changing filters, or clicking into the graphs for further detail, the top of the report will show that the parameters have been modified. The word ‘Modified’ will appear automatically. You can save the new view based on your changes by clicking on the down arrow next to ‘Modified’, and on ‘Save View’. This way you won’t have to reselect the changes again the next time you run it.
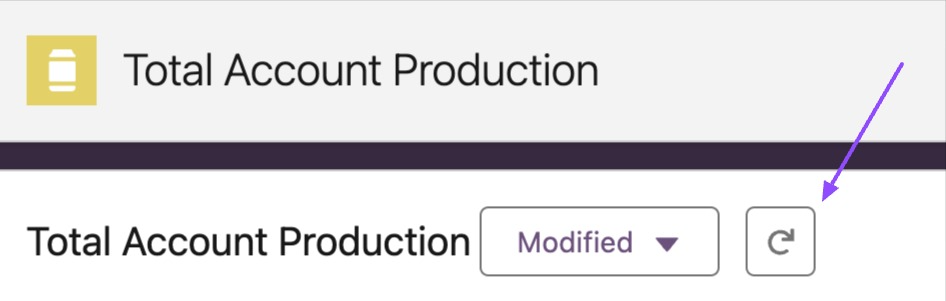
Click on the refresh icon ‘Return to Initial View’ to go back to the original dashboard.
Information Displayed on the Dashboard
The following information appears on your report:
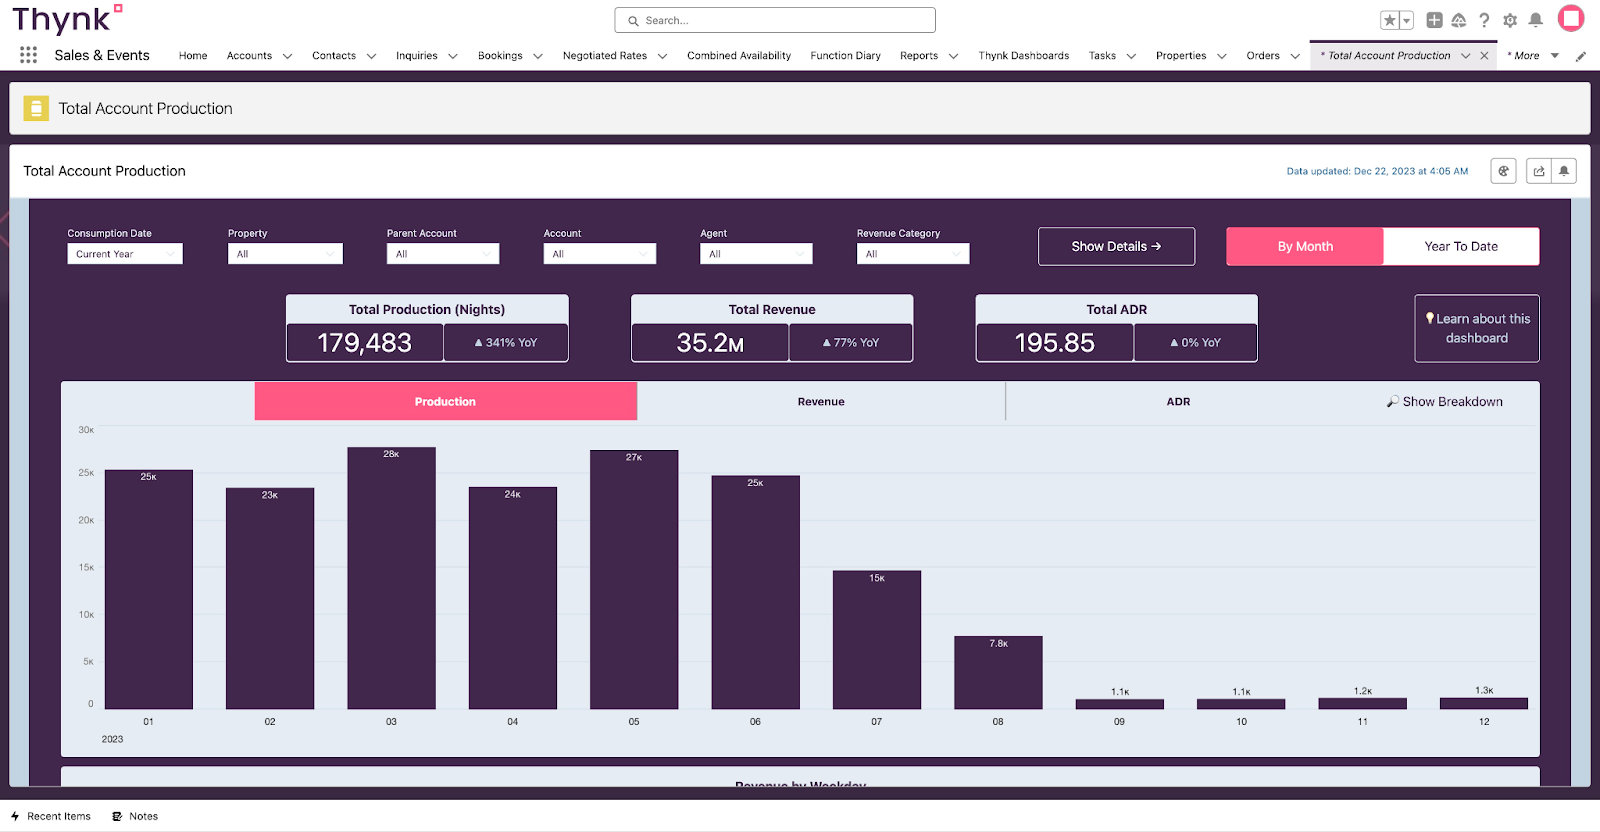
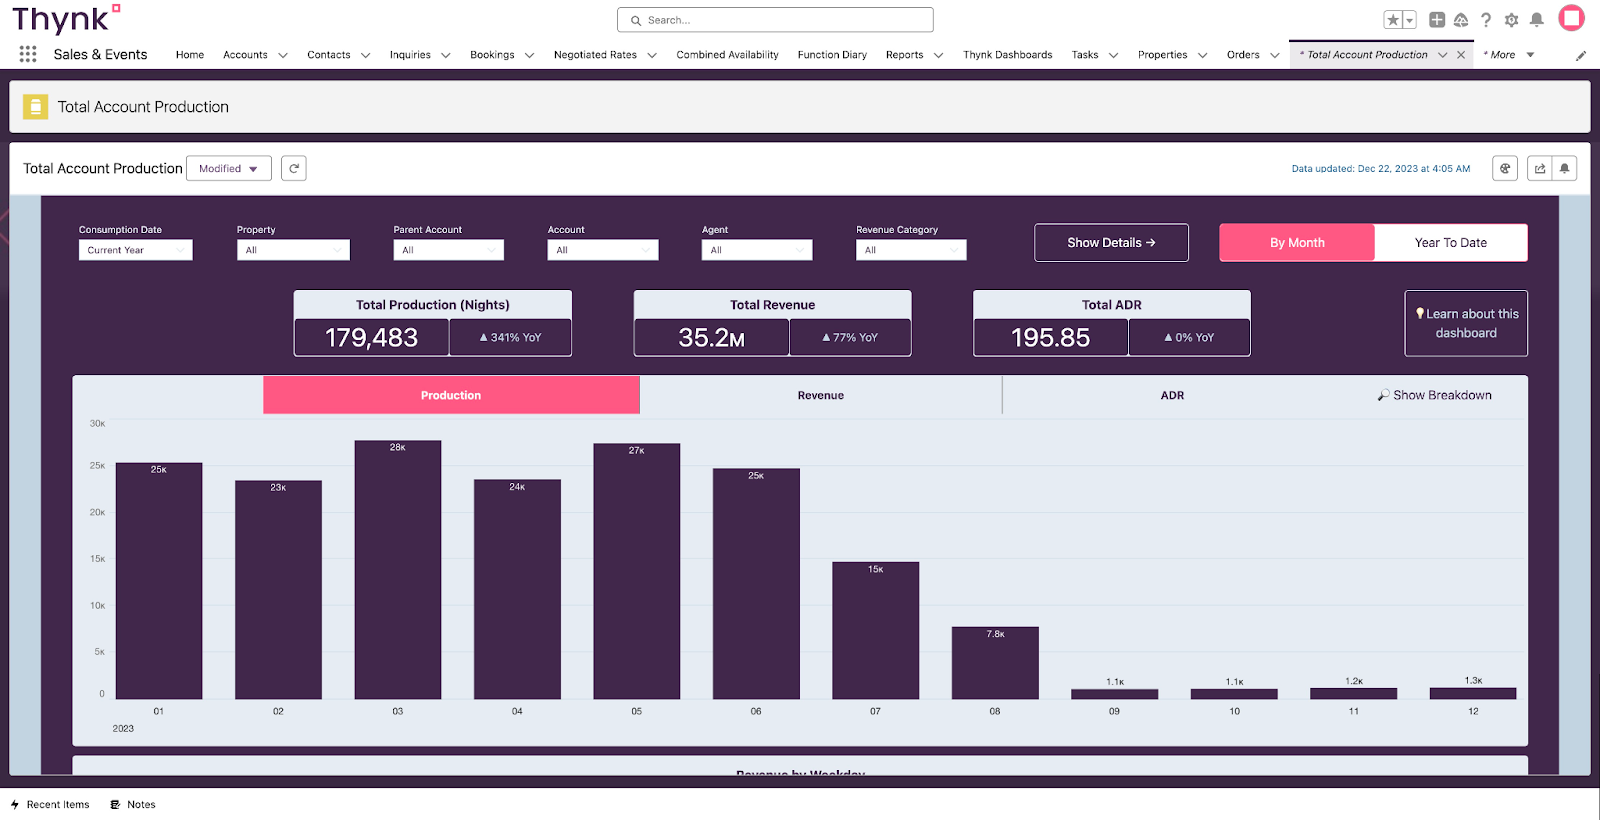
The top part of the dashboard shows all the filters.
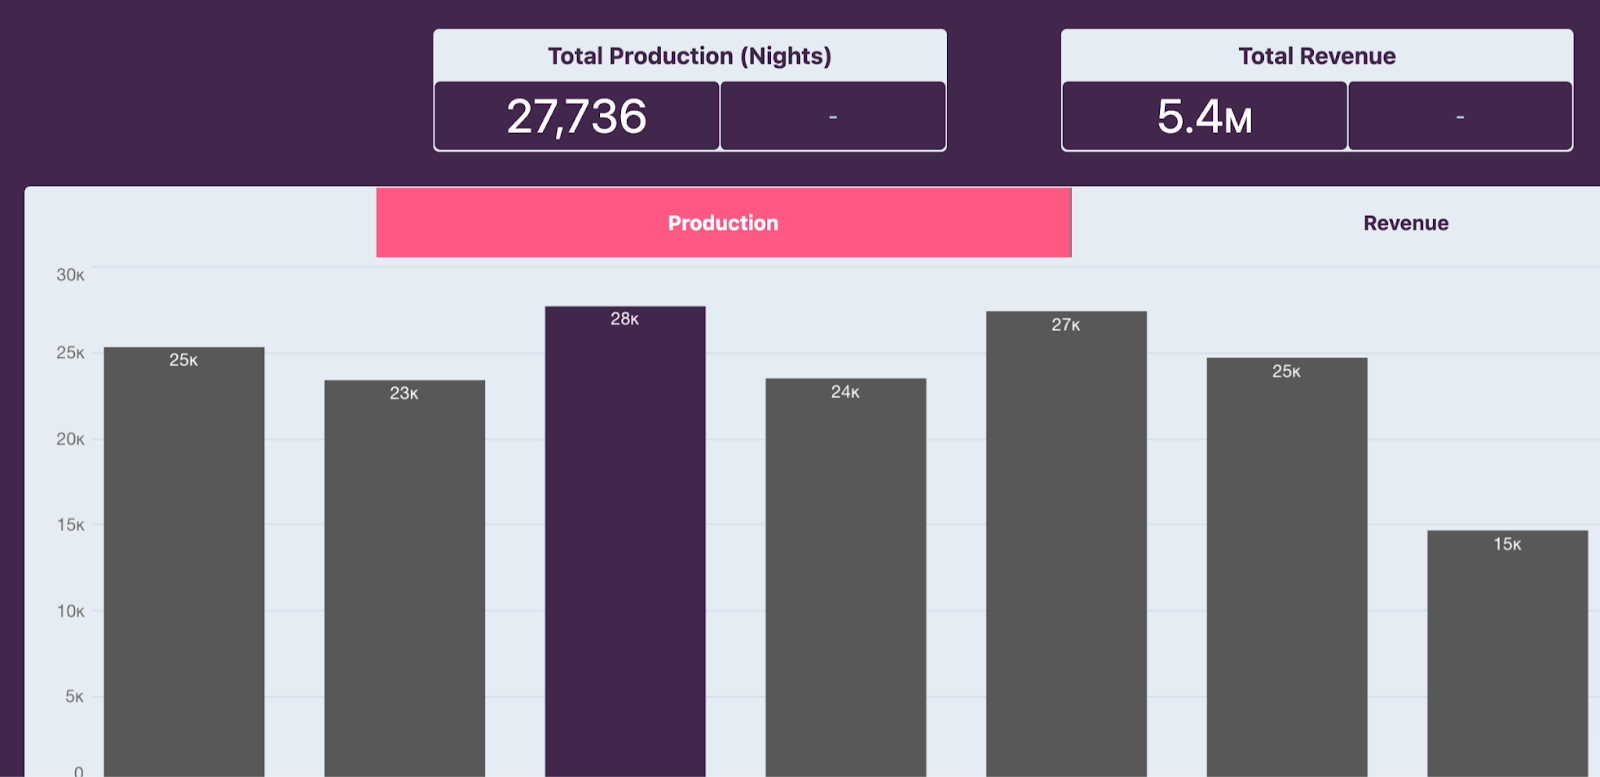
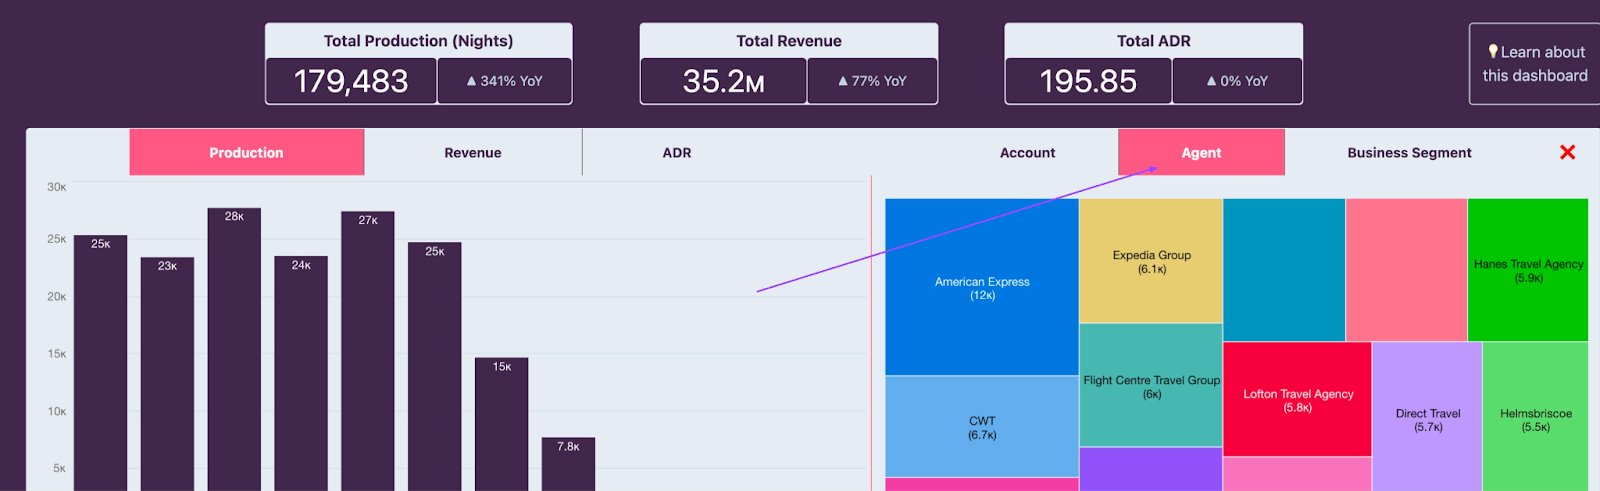
Under the filters, you will see total production numbers in room nights, revenue and ADR. The number on the right of these is showing you an increase or decrease compared to last year (%YoY) or year on year.

Under the total figures, there is a visual graph showing production by month: again, starting with room nights, revenue and ADR.
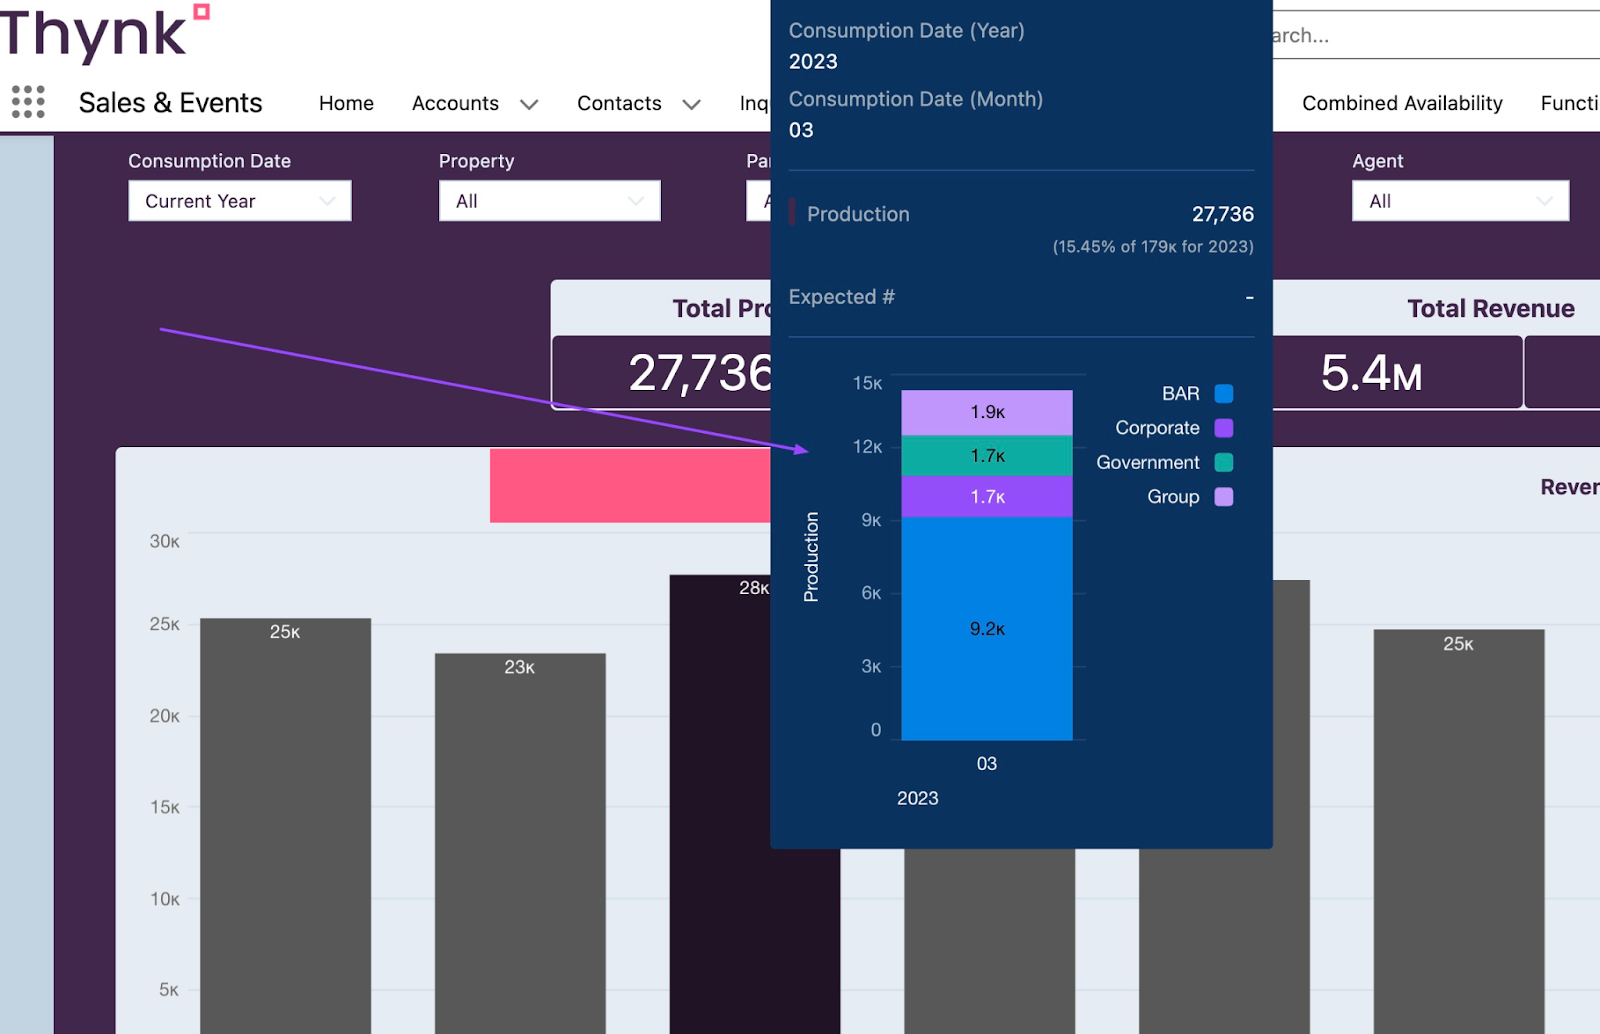
Click on a month and the total numbers change to show you just that month’s production. In this example below, I clicked on the 3rd month (purple) and the numbers changed.
Also, when you click on the month (or even hover), you will see the production by business segment. To go back to your total production view, just click on that same month again to deselect it.
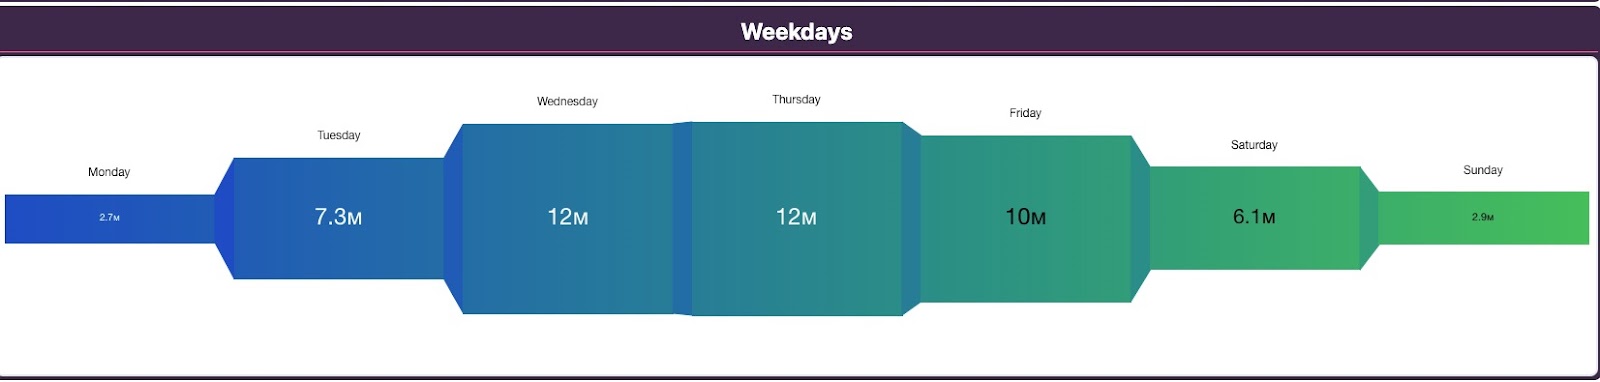
Scroll down to see production by week day to see where your bookings are falling. Hovering and/or clicking onto the weekday, gives you specifics on that day of the week.
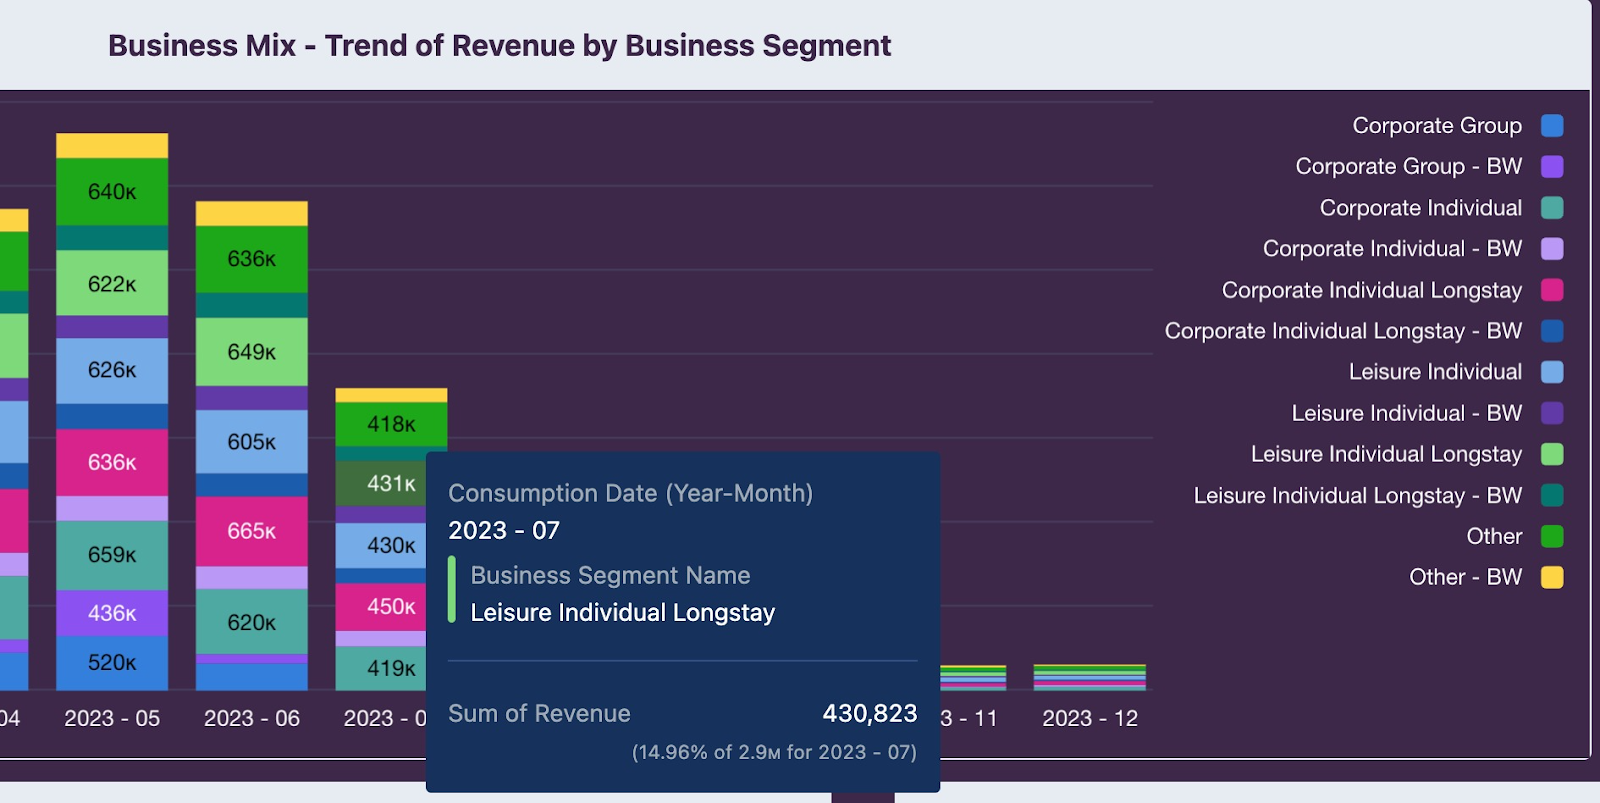
Scroll down to see the trend of revenue by business segment.
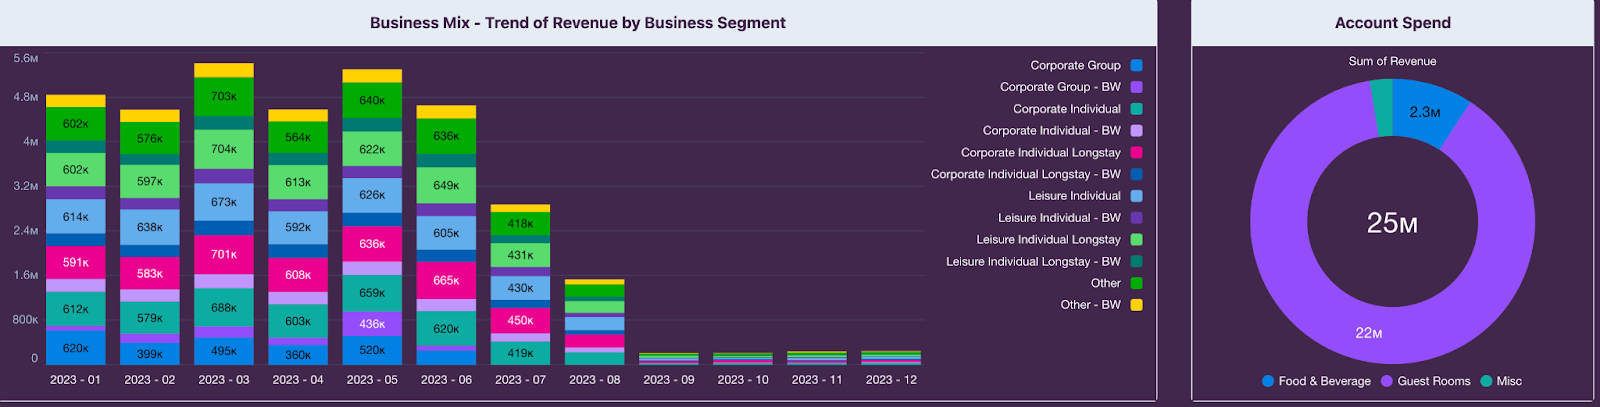
As always, you can hover over anything here to get further details. In this example, I hovered over the light green box on July, and I see that the total revenue sourced from Leisure Individual Long Stay was 430,823 revenue, which was 14.95% of 2.9 million revenue on that day.
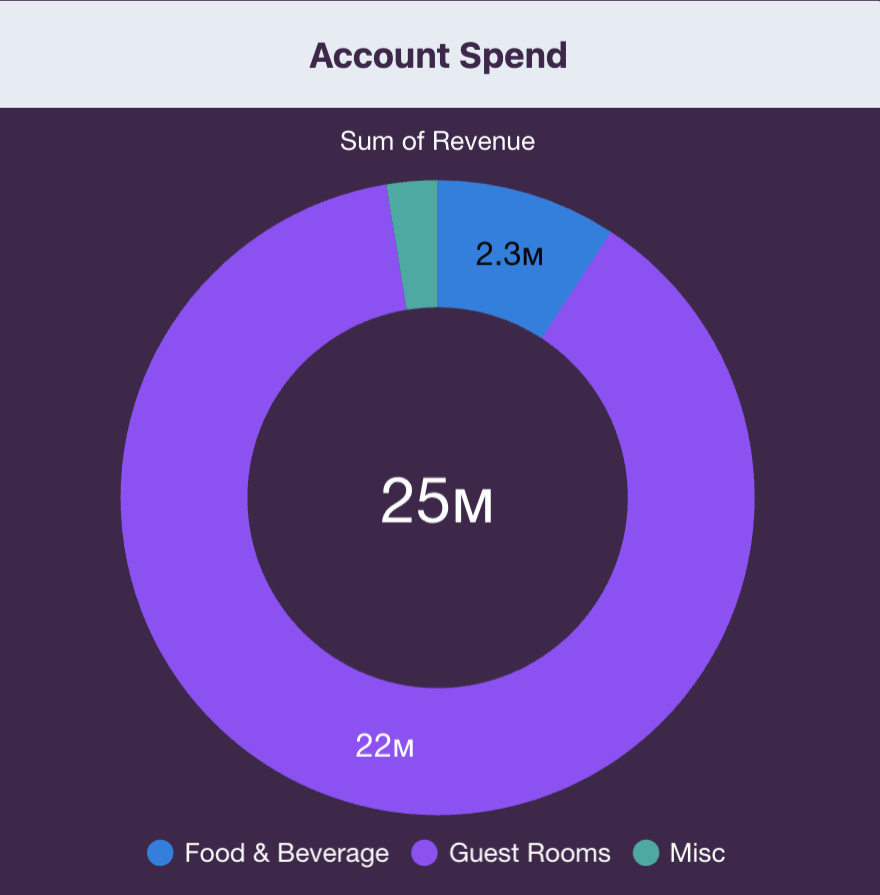
On the right of this, the graph shows the account spend broken down by F&B, guest room accommodations, and miscellaneous.
Below this, you can see Top Accounts and Top Contacts.
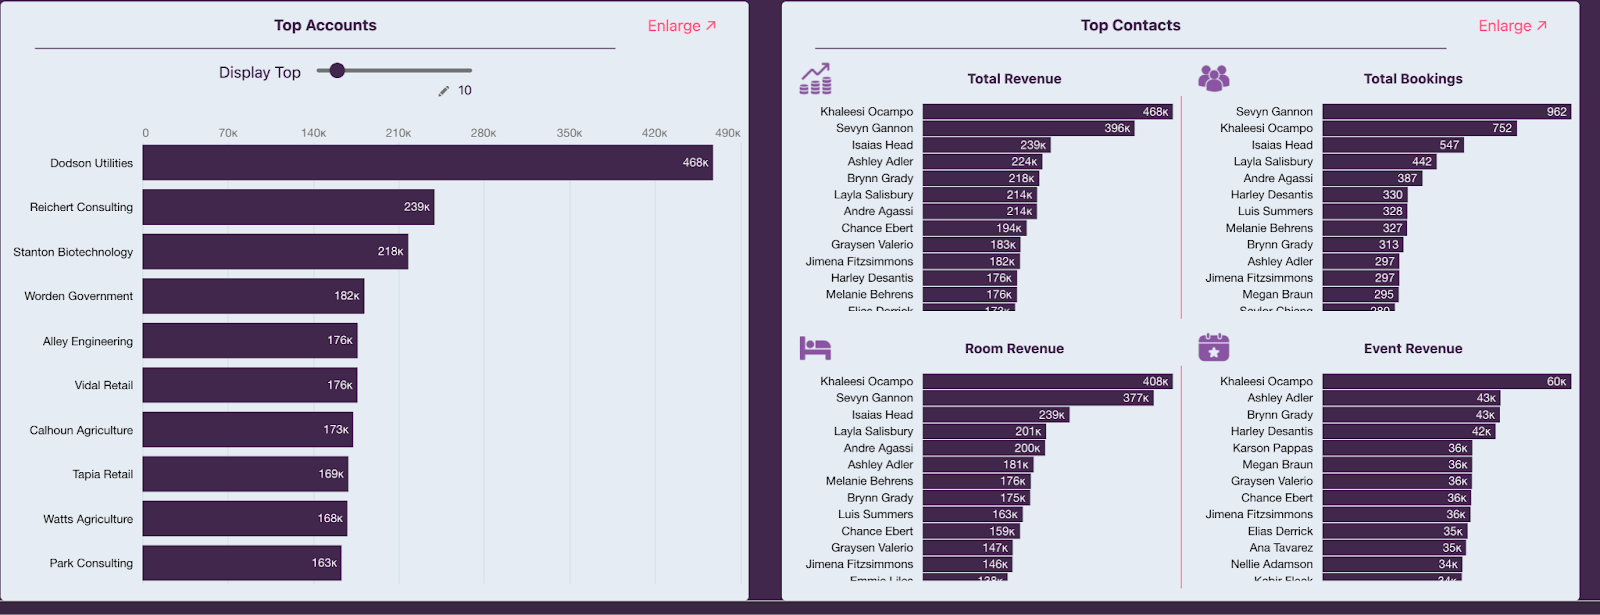
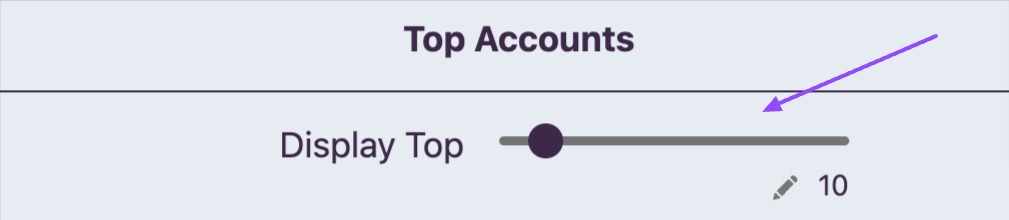
You can adjust the number of top accounts/contacts you wish to see by sliding the ‘Display top’ slider.
Click on ‘Enlarge’ and the view changes to show top Industry revenue totals. And as always you can drill down into them by hovering over them.
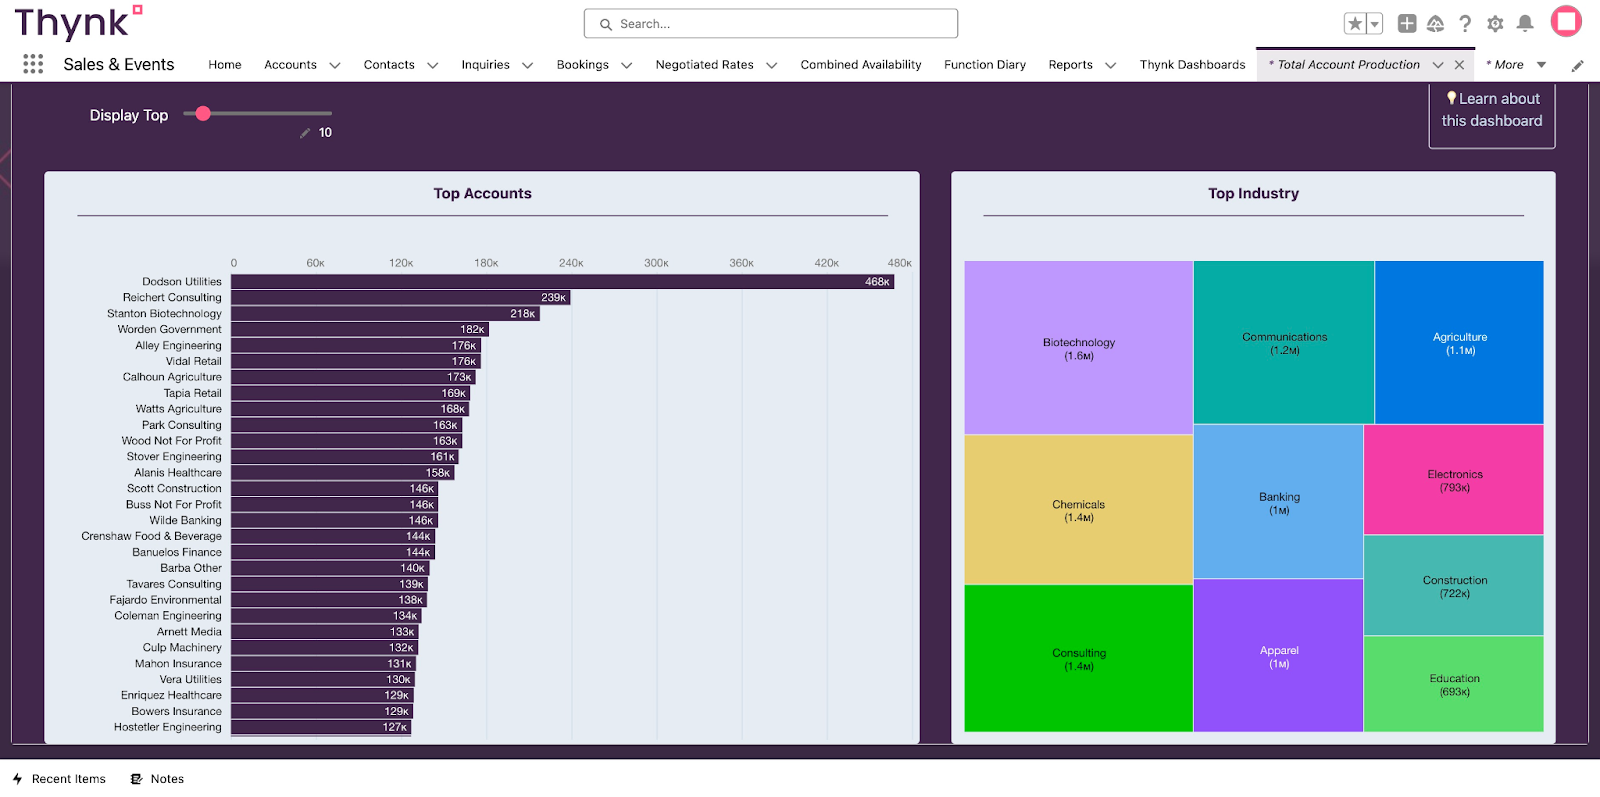
You can also click into the window to drill down further.
Scroll back up and click on the ‘back to overview’ purple button on the right to go back to the dashboard.
To view Agency information, click on the ‘Agent’ button, and the dashboard focuses on agency production.
Best Practices
Like other dashboards, this one is set up with predefined filters which you can change. Currently this report shows business consumed YTD with arrivals including next year. If you want to run a report to show all future arrivals, you can change the date filter.
If you are looking for a specific account or agency, you should change the filter ‘Account Name’ from showing ‘All’ to the one you are looking for.
If you are looking for production based on 'date booked' not 'consumption', please refer to the Booking Pace Dashboard.
Resources
Overview of Standard Reports & Dashboards - Knowledge base article
How to Edit Reports & Dashboards- Knowledge base article
Set and send smart notifications - Salesforce help article
Booking Pace Dashboard - Knowledge base article
Related Articles
How to see total production figures for an account or agency
Learning Objectives At the end of this lesson you will know how to…. How to find production figures for your account or agency Viewing the Account Production What’s my account or agency worth? How much business have they given me to date? What’s the ...Where to Track Agency Specific Account Information
Learning Objectives This article will show you …. Where you can track agency specific information on your accounts Where to enter agency commissions Entering Agency Specific Information As you work with accounts in Thynk you already know that ...Sales Manager Production Dashboard
Learning Objectives At the end of this lesson you will know how to…. Find the Sales Manager Production Dashboard Understand the information on the Dashboard Dashboard Overview The Sales Manager Production dashboard shows guest room and event ...Account Listing Report
Learning Objectives At the end of this lesson you will know how to…. Run the Account Listing Report Edit the report as needed Account Listing Report The Account Listing Report shows a list of accounts to see the current worth of each account so ...How to create a New Account and edit an Existing Account
Learning Objectives How to search for an account How to create a new account How to edit an existing account Which best practices to follow Standard Features in Thynk When working in Thynk, there are some very easy features that apply the same way in ...