Thynk Admin System Dashboard
Learning Objectives
Dashboard Overview
Dashboard Uses
- Transaction failures related to bookings, room blocks, reservations, and user engagement
The health of system integrations
System usage
How to View the Dashboard
To view this dashboard, follow these steps:
At the Thynk Home Page, go to the ‘App launcher’ and search for Dashboards. Click on ‘Dashboards’.
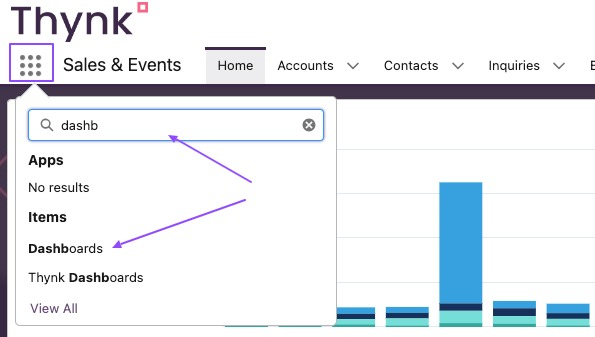
Search for ‘Thynk Admin System Dashboard’ and click on it to view it.
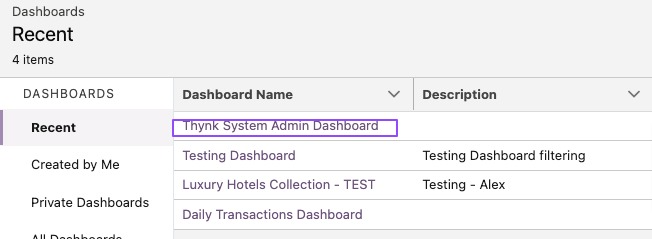
The system will generate the dashboard automatically.
If you are a very confident Thynk user and have a good experience editing dashboards, you can edit it here by clicking on the ‘Edit’ button on the top right.
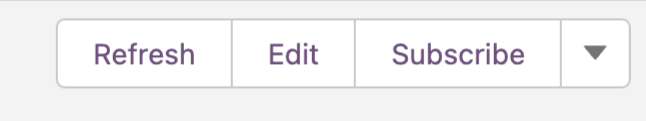
And of course, you can subscribe to the dashboard so it runs automatically.
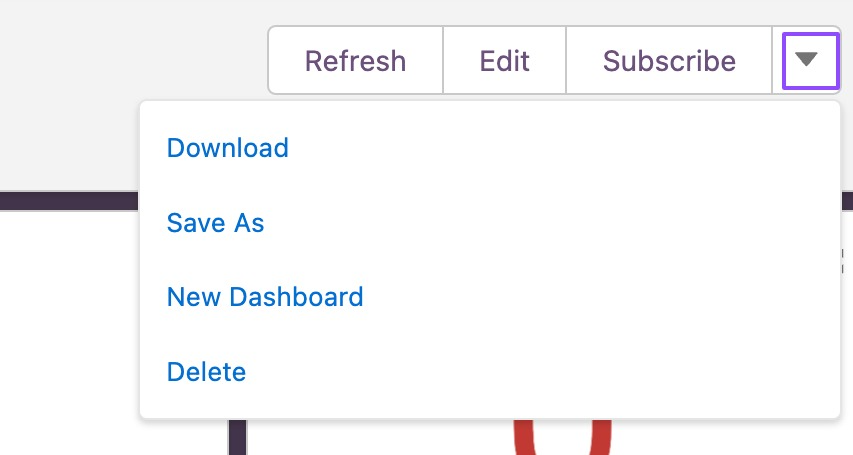
And if you click on the down arrow, you see other options:
Be sure to save the dashboard before you close it. "Saving As" is the best option as the dashboard will be saved as a permanent draft and can be reopened at any time.
Information Displayed on the Dashboard
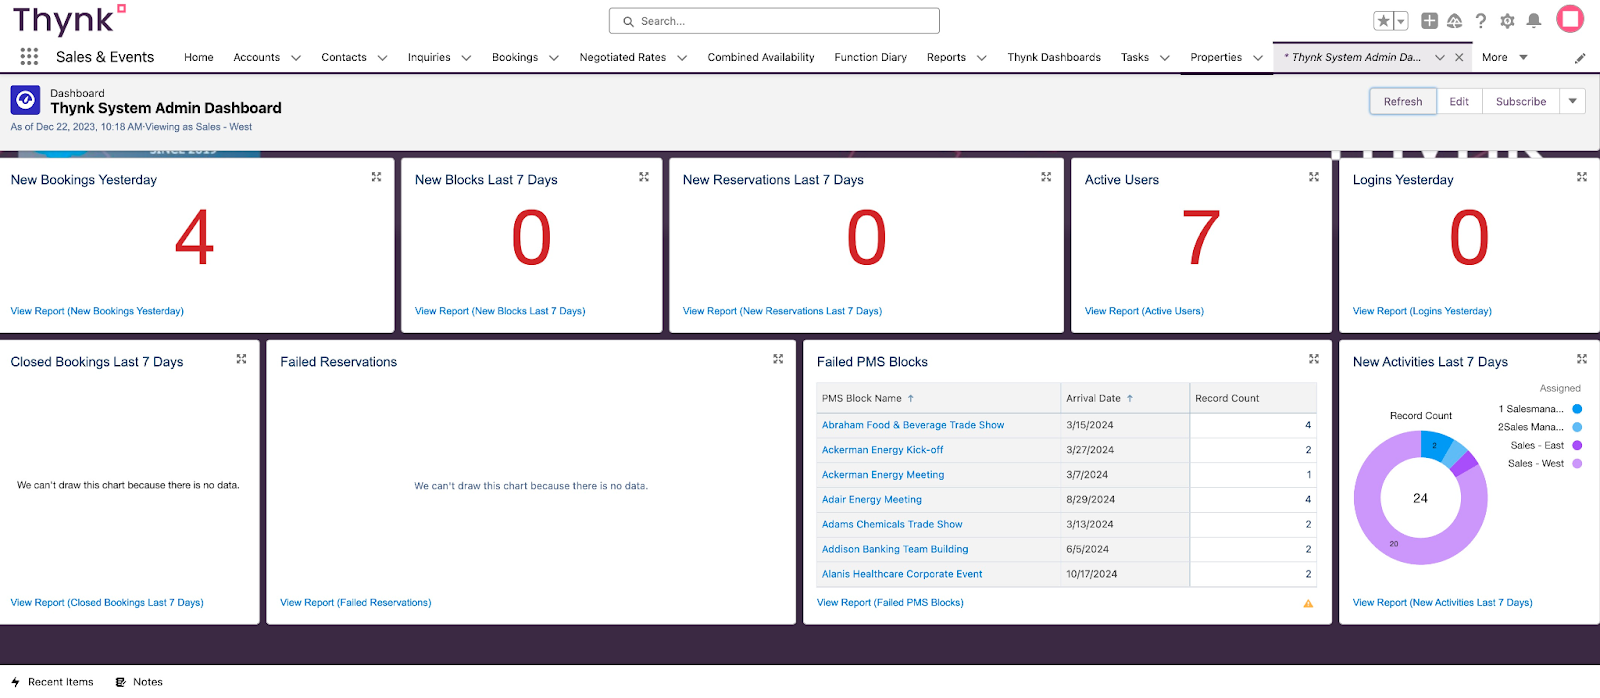
The following information appears on your dashboard - remember you can always click into the information to drill down further as needed. Starting on the top row of numbers, going from left to right:
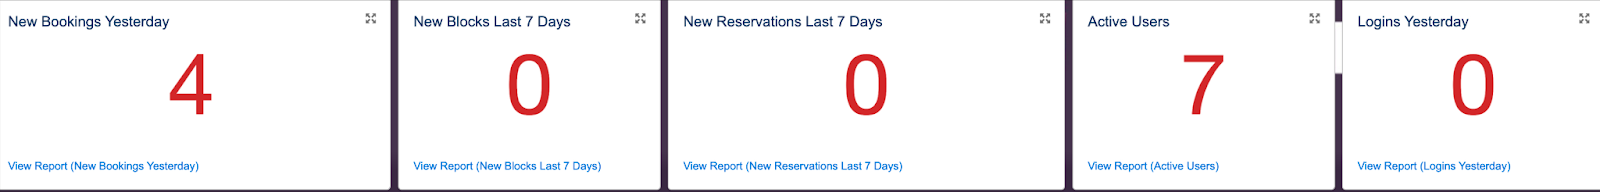
New Bookings Yesterday - total number of bookings created yesterday
New Blocks Last 7 Days - total number of new blocks created in the last 7 days
New Reservations Last 7 Days - total number of reservations in the last 7 days
Active Users - shows the total number of active users (those that are not deactivated due to turnover)
Logins Yesterday - shows the number of total users logged into Thynk yesterday
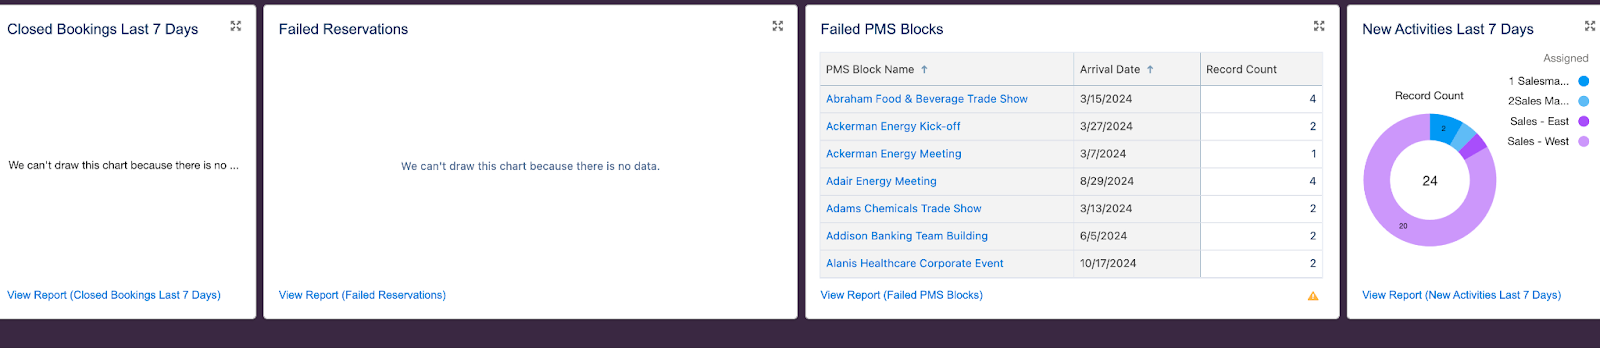
Closed Bookings Last 7 Days - this funnel chart shows you closed bookings the last 7 days, by owner and total revenue.
Failed Reservations - shows a table with Booking Name, Error Message and Record Count and link to open the booking.
Failed PMS Blocks - shows a table with PMS Block Name, Arrival Date and Record Count and link to open the PMS Block.
New Activities Last 7 Days - this pie chart shows new activities by the salesperson who is assigned to them.

Resources
Overview of Standard Reports & Dashboards - Knowledge base article
How to Edit Reports & Dashboards - Knowledge base article
Related Articles
November 2023 Product Updates
Below you will find a brief, high-level description of enhancements and new features included in the latest product updates. We listen to your feedback and you may see something you requested below. Give us more feedback about your experience with ...Overview of Standard Reports & Dashboards
Overview What is a Report vs a Dashboard? Reports and dashboards use data stored in Thynk. This is is why it's important that you have clean data. Most everyone now is familiar with what a report is. It's a document that allows you to analyze data ...May 2023 Product Updates
Bookings Bookings contain details such as the account information, contact for the booking, guest rooms blocked, function rooms, commissions, packages, and more. Here are the latest updates to help you manage your bookings more effectively and ...Sales Manager Production Dashboard
Learning Objectives At the end of this lesson you will know how to…. Find the Sales Manager Production Dashboard Understand the information on the Dashboard Dashboard Overview The Sales Manager Production dashboard shows guest room and event ...Daily Transactions Dashboard
Learning Objectives In this lesson you will learn... 1. Learn the uses of Daily Transactions Dashboards. 2. How to run a Daily Transactions Dashboard. 3. How to edit a Daily Transactions Dashboard and view its information. Report Overview The Daily ...